 VSCode下Vue的断点调试
# VSCode下Vue的断点调试.md
# 场景
前端调试代码,大多情况下我都会使用控制台的日志输出进行调试。但这在定位某些问题时会比较繁琐,要不停的增改输出,尤其是在调试其他人的代码时,会变得异常痛苦。
使用VSCode进行代码调试,会提高定位问题的效率。
此方法针对的是Vue2。
# 配置方法
# 安装Debugger for Chrome
首先确保VSCode中安装Debugger for Chrome (opens new window)
新版本不再需要安装此插件,VSCode已默认集成。
# 开启source-map
在webpack构建时,开启source-map,允许调试器将压缩代码映射回原文件相应的位置。
在vue.config.js中添加此配置:
module.exports = {
  configureWebpack: {
    devtool: process.env.NODE_ENV === 'development' ? 'source-map' : false
  }
}
# 配置babel.config.js
module.exports = {
  'env': {
    'development': {
      'sourceMaps': true,
      'retainLines': true
    }
  },
  presets: [
    '@vue/cli-plugin-babel/preset'
  ]
}
注意:有时会出现断点调试问题,async/await函数无法正常进行断点,这可能是因为babel转换的目标浏览器配置问题。可以在开发环境中配置预设的targets参数:
module.exports = {
  env: {
    development: {
      sourceMaps: true,
      retainLines: true
    }
  },
  presets: [
    ['@vue/app', {
      targets: { chrome: 88, node: 12 } // 关键点
    }]
  ]
};
上面的配置中,指定了预设的目标浏览器版本,优先级高于.browerslistrc中的配置,那么编译的代码只需要支持chrome版本88、node版本12。可解决上述问题。
# 配置launch.json
Vue: Start配置
我们是在调试一个Node项目,首先需要启动项目,代替在控制台中输入npm run start或yarn start配置:
{
  "name": "Vue: Start",
  "type": "node",
  "request": "launch",
  "protocol": "inspector",
  "runtimeExecutable": "${workspaceRoot}/node_modules/.bin/vue-cli-service",
  "env": { "NODE_ENV": "development", "DEVTOOL": "source-map" },
  "windows": {
    "runtimeExecutable": "${workspaceRoot}/node_modules/.bin/vue-cli-service.cmd"
  },
  "args":  ["serve", "--debug", "--mode development", "--open"],
  "preLaunchTask": "chrome-port-set",
  "console": "integratedTerminal"
}
runtimeExecutable配置要执行的命令vue-cli-service路径args配置执行命令时设置的参数preLaunchTask在执行此命令前,预执行的task,详见配置task.jsonconsole配置日志输出位置
以上配置输入类似手动终端输入npm run start启动项目,start配置如下
"scripts": {
  "start": "vue-cli-service serve --debug --mode development --open"
}
当前,如果package.json中已经配置了这条命令,可以配置执行npm或yarn命令,无需将所有参数都放在args参数中做拼接,args中加入想要额加入的参数即可,配置可改成:
{
  "name": "Vue: Start",
  "type": "node",
  "request": "launch",
  "protocol": "inspector",
  "runtimeExecutable": "yarn",
  "runtimeArgs": ["serve"],
  "args":  ["--color"], // 额外添加参数
  "windows": {
    "runtimeExecutable": "${workspaceRoot}/node_modules/.bin/vue-cli-service.cmd"
  },
  "args":  ["serve", "--debug", "--mode development", "--open"],
  "preLaunchTask": "chrome-port-set",
  "console": "integratedTerminal"
}
那么就等价于
"scripts": {
  "start": "vue-cli-service serve --debug --mode development --open --color"
}
Attach to Chrome配置
{
  "name": "Attach to Chrome",
  "type": "chrome",
  "request": "attach",
  "urlFilter": "http://localhost:*",
  "port": 9222,
  "timeout": 120000,
  "webRoot": "${workspaceRoot}/src",
  "sourceMaps": true,
  "sourceMapPathOverrides": {
    "webpack:///./src/*": "${webRoot}/*",
    "webpack:///src/*": "${webRoot}/*"
  }
}
port开启远程调试端口9222,这也是为什么要在Vue: Start配置预执行一个task,详见详见配置task.json开启远程端口配置sourceMapPathOverrides重写源文件映射关系
compounds 配置
"compounds": [
  {
    "name": "Vue: All",
    "configurations": ["Vue: Start", "Attach to Chrome"]
  }
]
- 配置同时启动
Vue: Start和Attach to Chrome
# Launch to Chrome 配置
启动项目后,也可单独运行此配置,使用launch方法断点调试。
{
  "type": "chrome",
  "request": "launch",
  "name": "Launch to Chrome",
  "url": "http://localhost:8025",
  "webRoot": "${workspaceFolder}/src",
  "breakOnLoad": true,
  "sourceMapPathOverrides": {
    "webpack:///src/*": "${webRoot}/*"
  }
}
完整配置如下:
{
  // Use IntelliSense to learn about possible attributes.
  // Hover to view descriptions of existing attributes.
  // For more information, visit: https://go.microsoft.com/fwlink/?linkid=830387
  "version": "0.2.0",
  "configurations": [
    {
      "name": "Vue: Start",
      "type": "node",
      "request": "launch",
      "protocol": "inspector",
      "runtimeExecutable": "${workspaceRoot}/node_modules/.bin/vue-cli-service",
      "args":  ["serve", "--debug", "--mode development", "--open"],
      "preLaunchTask": "chrome-port-set",
      "console": "integratedTerminal"
    },
    {
      "name": "Attach to Chrome",
      "type": "chrome",
      "request": "attach",
      "urlFilter": "http://localhost:*",
      "port": 9222,
      "timeout": 10000,
      "webRoot": "${workspaceRoot}/src",
      "sourceMaps": true,
      "sourceMapPathOverrides": {
        "webpack:///./src/*": "${webRoot}/*",
        "webpack:///src/*": "${webRoot}/*",
      }
    },
    {
      "type": "chrome",
      "request": "launch",
      "name": "vuejs: chrome",
      "url": "http://localhost:8025",
      "webRoot": "${workspaceFolder}/src",
      "breakOnLoad": true,
      "sourceMapPathOverrides": {
        "webpack:///src/*": "${webRoot}/*"
      }
    }
  ],
  "compounds": [
    {
      "name": "Vue: All",
      "configurations": ["Vue: Start", "Attach to Chrome"]
    }
  ]
}
# 配置tasks.json
启动项目前,我们需要开启远程调试端口,以便attach to chrome可以远程Attach到浏览器。
{
  // See https://go.microsoft.com/fwlink/?LinkId=733558
  // for the documentation about the tasks.json format
  "version": "2.0.0",
  "tasks": [
    {
      "label": "chrome-port-set",
      "type": "process",
      "command": "open",
			"args": ["/Applications/Google Chrome.app", "--args", "--remote-debugging-port=9222"],
      "windows": {
        "command": "C:\\Program Files\\Google\\Chrome\\Application\\chrome.exe",
        "args": [ "--remote-debugging-port=9222" ],
      },
      "isBackground": false,
      "problemMatcher": {
        "owner": "custom",
        "pattern": {
          "regexp": ""
        },
        "background": {
          "beginsPattern": "Starting development chrome\\.\\.\\.",
          "endsPattern": "Not launching vue app as debug argument was passed\\."
        }
      }
    }
  ]
}
"args": [ "--remote-debugging-port=9222" ]这里的端口号要和Attach to chrome中的端口号一致。
在桌面快捷方式中,添加参数,可加上chrome.exe --remote-debugging-port=9222 --user-data-dir=remote-debug-profile,两个参数的作用如下:
Setting the
--remote-debugging-porttells the browser to listen on that port for a debug connection. Setting a separate--user-data-dirforces a new instance of the browser to be opened; if this flag isn't given, then the command will open a new window of any running browser and not enter debug mode. vscode browser-debugging (opens new window)
也就是说:
-- remote-debugging-port告诉浏览器在该端口上侦听调试连接。-- user-data-dir将强制打开浏览器的一个新实例; 如果没有给出这个标志,那么该命令将打开任何正在运行的浏览器的一个新窗口,而不会进入调试模式。
在tasks.json中添加--user-data-dir=remote-debug-profile也可行,但每次都会打开一个没有任何插件的新窗口,没有自己扩展的任何Chrome插件,不便于Vue调试。但是不添加此参数,正如上面所说的,可能无法正常开启调试模式,我的做法是,关闭所有浏览器窗口,然后执行task开启一个调试模式的浏览器窗口,这样就可以解决此问题。
Windows环境下,可以写一个bat脚本,然后每次点击bat文件启动即可,这样就无需配置Task:
# chrome.bat
start C:\Program" "Files\Google\Chrome\Application\chrome.exe --remote-debugging-port=9222
注:路径中存在空格,可使用双引号对空格进行转义。
Mac环境下,创建一个Automater 。首选新建一个 Automater 应用, 然后选择 Run Shell Script,使用open命令并编辑所需要的参数:
open /Applications/Google\ Chrome.app --args --remote-debugging-port=9222
最后保存该脚本,下次可以通过桌面快捷方式启动了。
注:路径中存在空格,使用反斜杠\对空格进行转义。
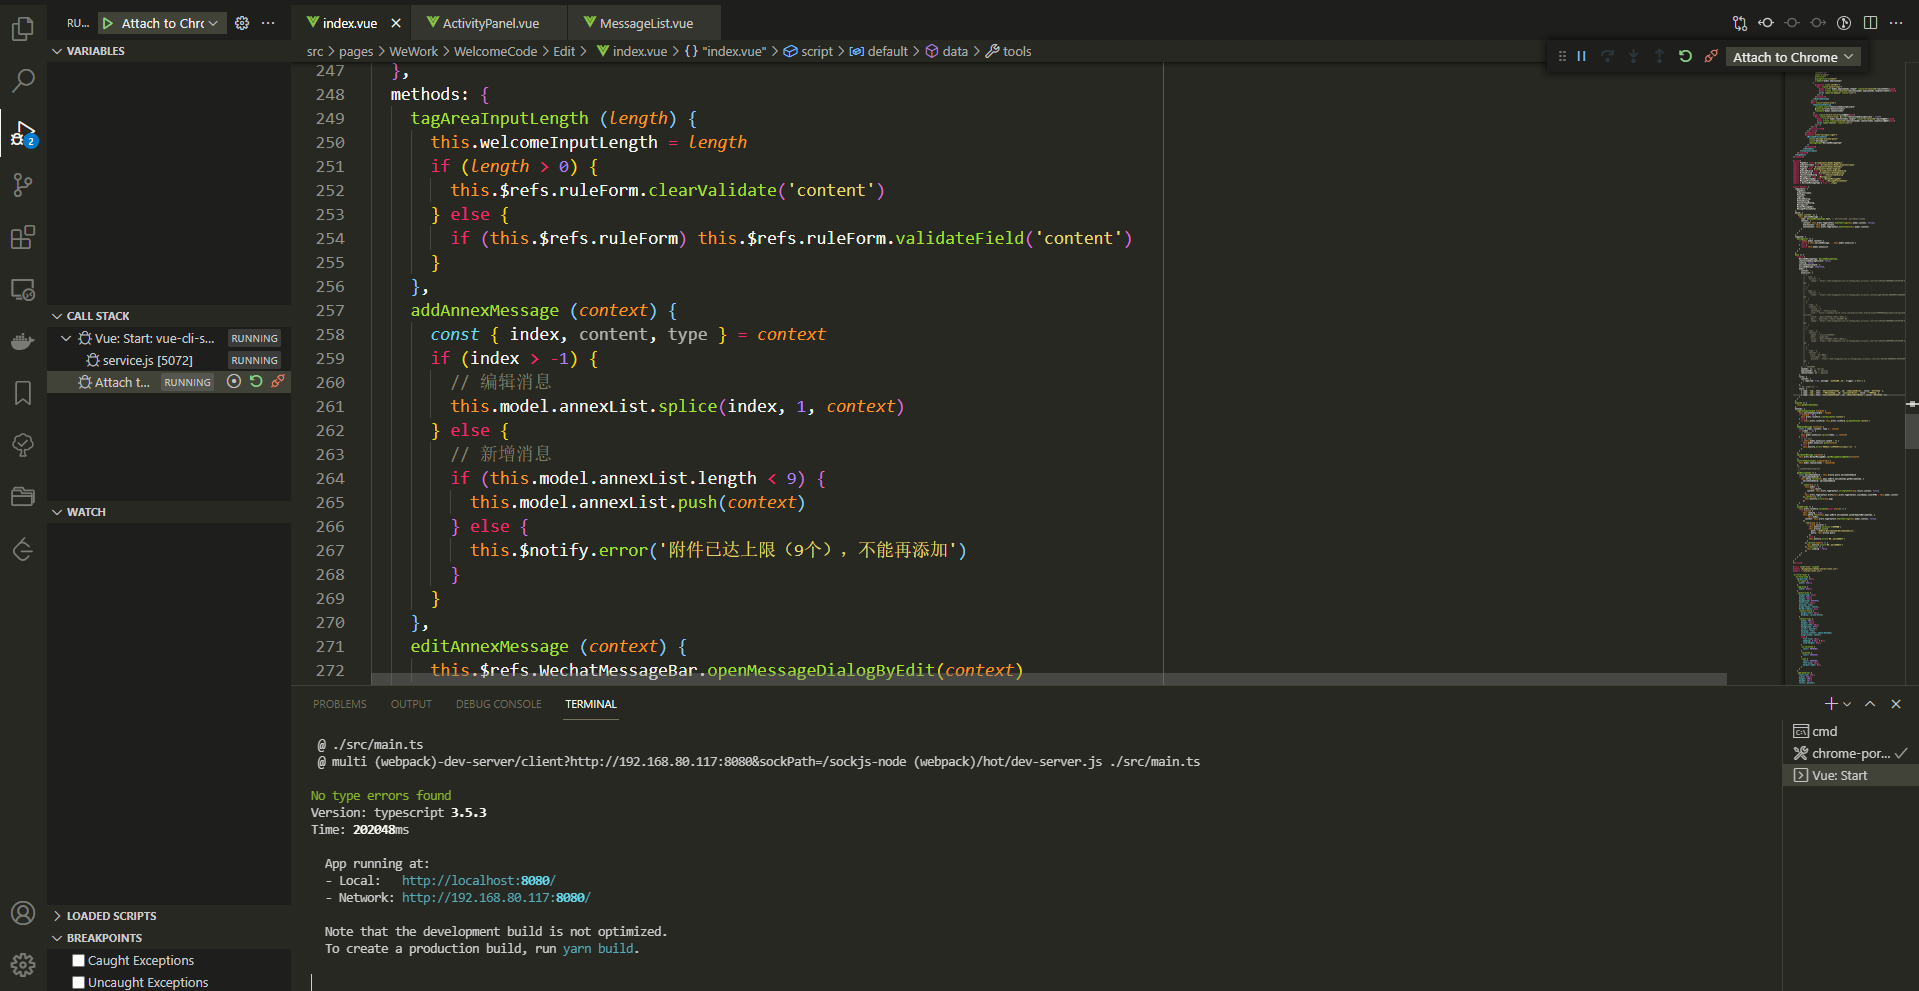
# 启动项目
点击Vue: All 启动项目,在项目中打断点然后进行操作,可看到效果。
可能遇到的问题:
- 项目启动时间过长,设置的
Attach to chrome下的timeout已经超时,但是Vue: start还未启动完毕。可以等到项目启动完成之后,再单击Attach to Chrome即可。 - 断点打不上,一定要在上面提到的浏览器中打开页面进行调试。
- 断点只能打到你当前在浏览器中建在的页面涉及的文件上,比如正在浏览编辑页面,那么断点可以打到编辑页面,但是无法在列表页面上打上可用断点。
- 如果使用这个浏览器还是打不开,可以尝试关闭所有的浏览器,再运行一下项目试试。
# 总结
根据Vue调试配置的经验,可借鉴相同的思路,调试webpack打包的各种项目。
vscode调试配置参数一览: vscode-js-debug options (opens new window)
参考链接:
- https://cn.vuejs.org/v2/cookbook/debugging-in-vscode.html
- https://juejin.cn/post/6844903805620846606
- https://code.visualstudio.com/docs/editor/debugging
- https://code.visualstudio.com/docs/nodejs/browser-debugging
- https://github.com/microsoft/vscode-js-debug/blob/main/OPTIONS.md