 Vscode中调试electron-vue的主进程和渲染进程
# Vscode中调试electron-vue的主进程和渲染进程
# 背景
最近接触了一个使用Electron-vue构建的项目,调试问题搞得人焦头烂额,使用electron自带的控制台断点调试,查看调用堆栈,常常回出现数据未定义的情况,而且难以找到自己想要断点的位置, 只能配合日志打印进行调试,每次保存都要进行热加载,等待项目重新编译,效率低下,身心备受折磨。
自接手项目以来已经两周,一直没有找到理想的调试方法,今天下午终于了解决此问题。
那么,下面开始具体的配置记录。
# 调试配置记录
这里直接使用electron-vue (opens new window)项目安装并做配置,具体安装可点击查看。
# 只调试主进程配置(attach方法)
# 配置launch.json
如果只想在Vscode中调试主进程,在Chrome Devtools中调试渲染进程,在launch.json的configurations中做如下配置:
{
    "name": "Electron: Main (attach)",
    "type": "node",
    "request": "attach",
    "cwd": "${workspaceFolder}",
    "outFiles": ["${workspaceFolder}/**/*.js"],
    "skipFiles": ["init.js"],
    "smartStep": true,
    "sourceMaps": true,
    "protocol": "inspector",
    "port": 5858,
    "timeout": 20000
}
# 配置webpack.main.config.js
第二步打开.electron_vue/webpack.main.config.js文件,添加一行代码:
/**
 * Adjust mainConfig for development settings
 */
if (process.env.NODE_ENV !== 'production') {
  mainConfig.devtool = 'source-map'; // < 这里
  mainConfig.plugins.push(
    new webpack.DefinePlugin({
      '__static': `"${path.join(__dirname, '../static').replace(/\\/g, '\\\\')}"`
    })
  )
}
# 配置package.json
同时修改package.json中scriptspackage.json下的dev,添加--no-lazy执行参数:
"dev": "node --no-lazy .electron-vue/dev-runner.js",
Note:在终端运行node --v8-options可查看到其中一个选项:
--lazy (use lazy compilation)
      type: bool  default: true
- 使用前缀
no可以设置此选项的值false,这将迫使V8引擎完成代码的完整编译,从而能与Vscode一起正常工作,不必使用debugger就可以在代码中进行断点调试。
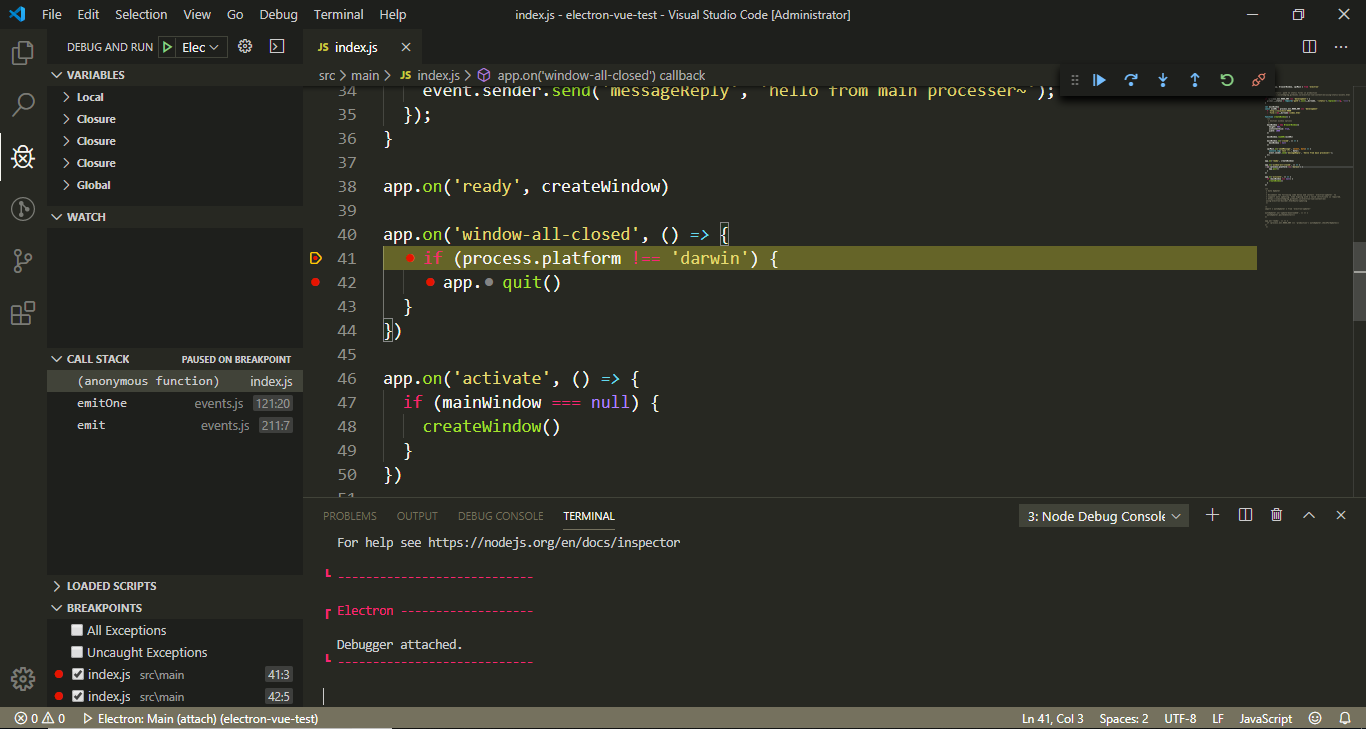
然后控制台使用npm run dev方式启动项目,再Vscode的Debug菜单中选择Electron: Main (attach)后F5运行,在主进程./src/main/index.js中打上断点,这里在时间window-all-closed的回调函数中断点。
app.on('window-all-closed', () => {
  if (process.platform !== 'darwin') { // < 断点
    app.quit()  // < 断点
  }
})
关闭Electron的运行窗口,即可看到断点效果。
# 主+渲进程调试
我比较习惯在vscode中进行所有的逻辑代码调试工作,方便断点,效率更高。但是此调试方法存在一个问题,在调试渲染进程代码时,如果打开Electron中的控制台,Vscode中的渲染进程会退出,详细原因下面进行总结说明。
# 主进程配置
在Vscode中点击调试>添加配置>Node,在configurations下添加配置。
{
    "type": "node",
    "request": "launch",
    "name": "Electron: Main (npm)",
    "cwd": "${workspaceFolder}",
    "outFiles": ["${workspaceFolder}/dist/electron/*.js"],
    "runtimeExecutable": "npm",
    "runtimeArgs": ["run-script", "dev"],
    "outputCapture": "std",
    "smartStep": true,
    "sourceMaps": true,
    "protocol": "inspector",
    "port": 5858,
    "timeout": 20000,
    "console": "integratedTerminal" // 个人习惯在Terminal中output
}
这里也要记得在.electron_vue/webpack.main.config.js中添加devtool配置的代码。
# 渲染进程配置
# 配置launch.json
在Vscode中点击调试>添加配置>Node,在configurations下添加渲染进程配置。
{
    "name": "Electron: Renderer",
    "type": "chrome",
    "request": "attach",
    "port": 9223,
    "urlFilter": "http://localhost:*",
    "timeout": 30000,
    "webRoot": "${workspaceFolder}/src",
    "sourceMapPathOverrides": {
        "webpack:///./src/*": "${webRoot}/*",
        "webpack:///src/*": "${webRoot}/*",
        "webpack:///*": "*",
        "webpack:///./~/*": "${webRoot}/node_modules/*"

    }
}
然后添加compounds参数配置:
"compounds": [
    {
        "name": "Electron: All",
        "configurations": ["Electron: Main (npm)", "Electron: Renderer"]
    }
]
# 修改webpack配置
分别修改webpack.renderer.config.js和webpack.web.config.js中的devtool字段值为source-map。
# 修改dev-runner.js
想要在Vscode中调试前端代码,此处要开启远程调试端口--remote-debugging-port,在dev-runner.js中找到startElectron()方法,添加参数配置:
function startElectron () {
  var args = [
    '--remote-debugging-port=9223', // < 这里
    '--inspect=5858',
    path.join(__dirname, '../dist/electron/main.js')
  ]

 ...
}
# 开启调试
到此配置已经完成,回到Vscode打开debug,选择Electron: All,F5运行。
# Chrome Devtools正常运行
项目可以正常跑起来了,看似正常,等待几秒之后,会发现渲染进程报错:
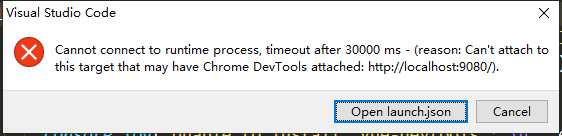
Cannot connect to runtime process, timeout after 30000 ms - (reson: Can`t attach to this target that may have Chrome Devtools attached: http://localhost:9080/).
此问题在于项目在在测试环境中启动时,加载项目的入口文件是src/main/index.dev.js,此文件下加载了electron-debug (opens new window)模块,此模块添加了Chrome Devtools,也就是我们看到的Electron的控制台。
虽然chrome支持多debugger调试,但是Node仅支持单个debugger的attach,所以,当我们F5启动项目时,首先就加载了一个Chrome Devtools在项目中,然后才是Vscode的attach,此时便会看到上面的报错。
解决办法就是,首先关掉此debug,修改index.dev.js,将showDevTools的参数改为false:
// Install `electron-debug` with `devtron`
require('electron-debug')({ showDevTools: false })
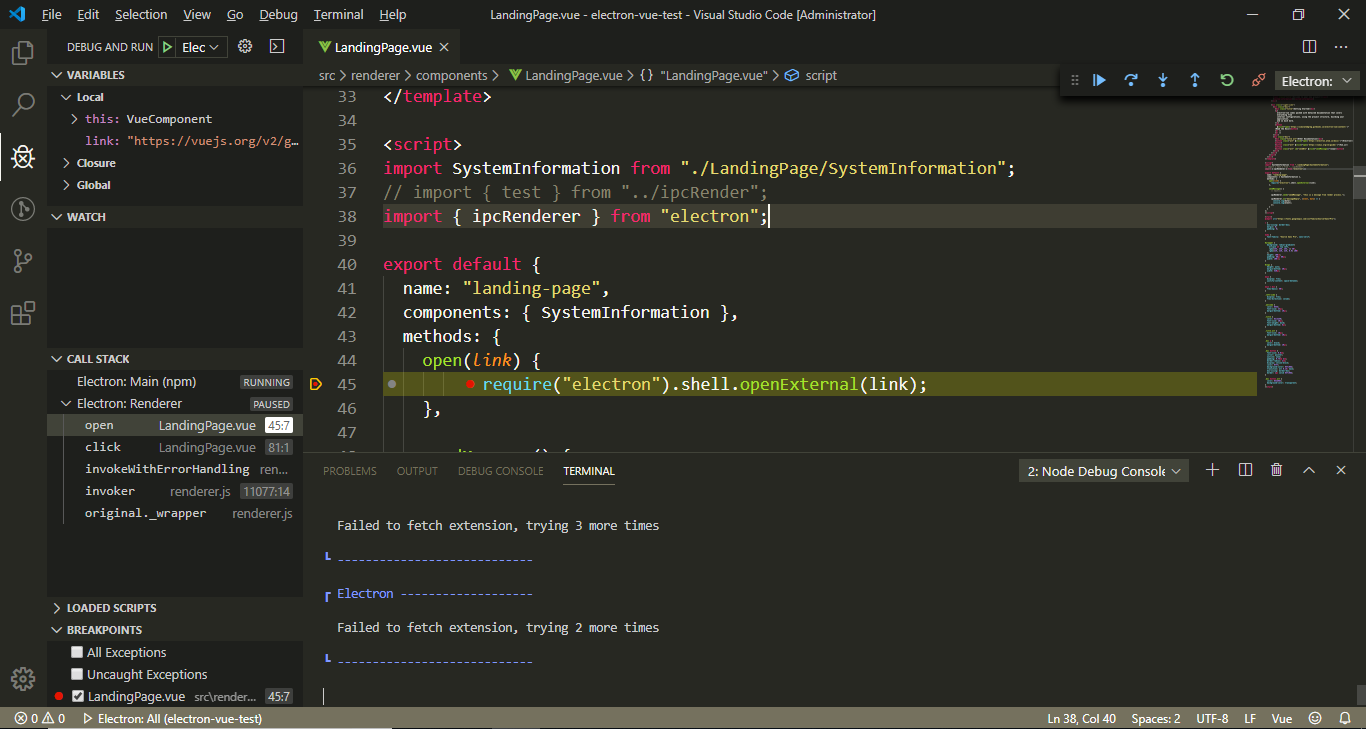
重新F5启动项目,可进行断点调试,需要注意的是,**如果在调试过程中打开electron的调试控制台,渲染进程便会退出。**原因如上所述,控制台会强行挤掉Vscode中渲染进程的debugger。利用Vscode查看逻辑代码很方便。
# 疑惑点
有的时候,如果Chrome Devtools报错,就不会出现上述的争抢问题,Vscode和Chrome Devtools可以同时很好的运行,并未修改showDevTools参数,项目可以很好的运行,那么就会有近乎完美的调试体验。
我在接手的项目中遇到的情况就是这种情况,Chrome控制台见如下报错:
DevTools failed to parse SourceMap: http://localhost:9080/renderer.js.map
Vscode终端报错:
[13056:1231/105120.982:ERROR:CONSOLE(5618)] "SyntaxError: Unexpected token i in JSON at position 2356435", source: chrome-devtools://devtools/bundled/shell.js (5618)
此实可以正常调试,不知道是不是与Devtools未正常加载有关系。
项目中运行代码,有时并没有出现报错,也可以很好的运行,到底是怎么回事,摸不着头脑。
# launch.json完整配置
{
    "version": "0.2.0",
    "configurations": [
        {
            "type": "node",
            "request": "launch",
            "name": "Electron: Main (npm)",
            "cwd": "${workspaceFolder}",
            "outFiles": ["${workspaceFolder}/dist/electron/*.js"],
            "runtimeExecutable": "npm",
            "runtimeArgs": ["run-script", "dev"],
            "outputCapture": "std",
            "smartStep": true,
            "sourceMaps": true,
            "protocol": "inspector",
            "port": 5858,
            "timeout": 20000,
            "console": "integratedTerminal"
        },
        {
            "name": "Electron: Renderer",
            "type": "chrome",
            "request": "attach",
            "port": 9223,
            "urlFilter": "http://localhost:*",
            "timeout": 30000,
            "webRoot": "${workspaceFolder}/src",
            "sourceMapPathOverrides": {
              "webpack:///./src/*": "${webRoot}/*",
              "webpack:///src/*": "${webRoot}/*",
              "webpack:///*": "*",
              "webpack:///./~/*": "${webRoot}/node_modules/*"
            }
        },
        {
            "name": "Electron: Main (attach)",
            "type": "node",
            "request": "attach",
            "cwd": "${workspaceFolder}",
            "outFiles": ["${workspaceFolder}/**/*.js"],
            "skipFiles": ["init.js"],
            "smartStep": true,
            "sourceMaps": true,
            "protocol": "inspector",
            "port": 5858,
            "timeout": 20000
        }
    ],
    "compounds": [
        {
          "name": "Electron: All",
          "configurations": ["Electron: Main (npm)", "Electron: Renderer"]
        }
    ]
}
参考:
- https://stackoverflow.com/questions/48091899/electron-main-and-renderer-process-debug-configuration
- https://github.com/Microsoft/vscode/issues/57826
- https://github.com/Microsoft/vscode-recipes/tree/master/vuejs-cli